Everyone abhors poverty. But many drastically overstate the problem, or rush to judgment about the proper policy response. This is the first of a multi-part look at poverty. Today's topic: measuring poverty.
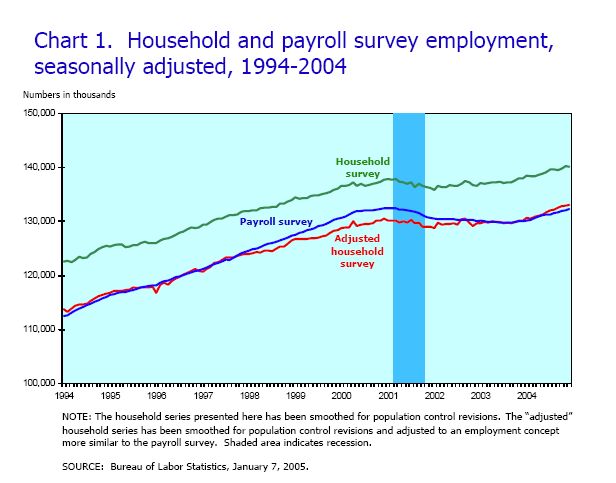
- Jobs in the US are plentiful: At least in comparison with Europe, America is a largely classless society. Without a hereditary aristocracy, US poverty largely is a function of employment, as Sowell observes: "Census data show that most people who are working are not poor and most people who are poor are not working." And, according to the Bureau of Labor Statistics, U.S. employment rates are historically quite high, both nationally and state-by-state, suggesting poverty also has been reduced.
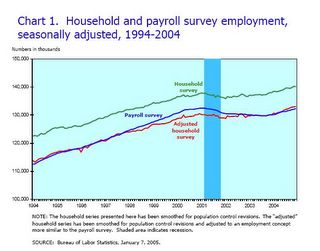
Employment's Rising (click to enlarge)
Still, lefties often dismiss the numbers on grounds that America's official statistics underreport the unemployed, supposedly by including only the jobless collecting welfare. It's true different countries have different statistical measures, making trans-national comparison difficult. But, the notion that U.S. employment numbers are linked to welfare is entirely false, as even a cursory review of the official BLS website reveals: "Persons are classified as unemployed if they do not have a job, have actively looked for work in the prior 4 weeks, and are currently available for work." - American jobs are remunerative and stable: During the Presidential campaign, John Kerry and the media insisted that America employment increasingly was limited to low-status "Mc-Jobs." This is nonsense; even FactCheck.Org reported, "the jobs gained are overwhelmingly good jobs -- the very opposite of the claim made by Kerry and his allies." Robert J. Barro says the same in Business Week:
Data from the Bureau of Labor Statistics show that the growth rate of average hourly earnings of production workers in the total private economy from January, 2001, to September, 2004, was 2.7% per year. To adjust for inflation, we subtract 1.9% per year for changes in the price deflator for personal consumer expenditures. Thus, real hourly earnings grew by 0.8% per year. Finally, we should adjust for fringe benefits. Because benefits rose faster than earnings, total real labor compensation per hour rose by 1.3% per year.
And growing part-time employment is another strength of America; part-time work is rare in Europe, because of high pension unemployment benefit taxation. Still, lefties claim that newer jobs are lower paid. Economist Thomas Sowell dispels this myth:The front-page headline on the May 31st issue of BusinessWeek says: "One in four workers earns $18,800 a year or less, with few if any benefits. What can be done?"
And, of course, real incomes have been rising recently, helping both full- and part-time workers. The increase in part-time employment represents a choice not available to Europeans. Hence more jobless, and more long-term unemployment, in Europe, according to the National Center for Policy Analysis:
Buried inside is an admission that about a third of these are part-time workers and another third are no more than 25 years old. So we are really talking about one-third of one fourth — or fewer than 10 percent of the workers — who are "working poor" in any full-time, long-run sense.
American Jobs are Durable (click to enlarge)
Most Americans with jobs aren't poor. And most American jobs pay well and aren't temporary--which is good for reducing poverty. - America's poverty problem is overstated by short-term trends: The Census Bureau collects poverty data, and its most recent summary (through 2003) reflected a slight increase in the poverty rate over the past three years (to between 10 percent and 12.8 percent, depending on how measured). This prompted predictable panic from politicians and the press. Is the panic justified? No--because long-term poverty trends are favorable.
The most recent poverty numbers reflect a just-ended recession that began in mid-2000: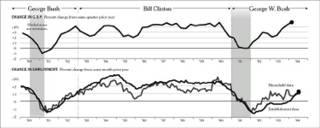
The Recession's Timing (click to enlarge)
In fact, the current poverty rate is less than recession-prompted peaks in 1993 and 1982:
Poverty and Recession (click to enlarge)
So, poverty's historically declined. Undoubtedly, the official poverty statistics will improve this year with the strong economy. - Census Bureau statistics overstate the historical problem: To reflect inflation, the poverty threshold properly increases each year. The threshold for a household of two in 2003 was just over $12,000, up from just over $1,400 in 1960. But when measuring income -- to determine which families are poor -- what's notable is what's not measured:
Data on consumer income collected in the CPS by the Census Bureau cover money income received (exclusive of certain money receipts such as capital gains) before payments for personal income taxes, social security, union dues, medicare deductions, etc. Therefore, money income does not reflect the fact that some families receive part of their income in the form of noncash benefits, such as food stamps, health benefits, rent-free housing, and goods produced and consumed on the farm. In addition, money income does not reflect the fact that noncash benefits are also received by some nonfarm residents which often take the form of the use of business transportation and facilities, full or partial payments by business for retirement programs, medical and educational expenses, etc. Data users should consider these elements when comparing income levels.
Put in layman's terms, when calculating the percentage of Americans who are poor, the official figures do not include subsidies such as Medicare and Medicaid, housing and food stamps. Thus at least some of the poor are better off than reflected by the numbers.
More importantly, the poverty threashold does not consider the overall improvements in society that benefit all. For example, today's poor are better off then those in poverty years ago, says Economist Bruce Bartlett:In a supplementary report that got no press attention, the Census Bureau looked at some of these new necessities and their ownership by the poor. It turns out many poor people today own appliances that were considered luxuries when I grew up, and some that would still be considered luxuries today. For example, 91 percent of those in the lowest 10 percent of households — all officially poor — own color TVs, 74 percent own microwave ovens, 55 percent own VCRs, 47 percent own clothes dryers, 42 percent own stereos, 23 percent own dishwashers, 21 percent own computers and 19 percent own garbage disposals.
Moreover, the poverty level doesn't consider the improvement in quality of life resulting from advances goods or services not newly invented. For example, cars and medical care are safer and better than ever before. However, poorer Americans who consume such products and assistance are more comfortable than their historical equivalents. As quantified by Bjorn Lomborg in his authoritative The Skeptical Environmentalist (chapter 6), the widespread distribution of improved and new consumer goods, education, safety and services makes today's low earners far less poor then in the past. Finally, when measuring incomes, the Census Bureau doesn't consider home ownership, thus ignoring the single most important source of wealth for Americans.
When I grew up in the 1950s, only the wealthy owned color TVs, clothes dryers, stereos, dishwashers and disposals. These were all considered luxuries. We got by with black-and-white TVs, hanging our wet clothes on a line to dry, washing dishes by hand and throwing our potato peels in a pail instead of down the drain. So did most other middle-class families. Not even the wealthiest people owned microwave ovens, VCRs or computers. - Income inequality is overstated--unchanged or declining: Another oft-heard argument is that poverty is linked to the gap between the highest and lowest earners that, allegedly, is increasing. This, too, is wrong.
By most common measures (including the so-called "Gini coefficient," see page 4 of link), the gap between earnings of high and low income Americans has stabilized. Still, some complain about historical trends, based on conventional Census numbers showing that "the top or most affluent quintile had 49.7 percent of income, while the bottom quintile had only 3.5 percent. Thus, the top fifth of households is shown to have 14.3 times more income than the bottom fifth." But, these statistics are misleading for two reasons, according to Robert Rector and Rea Hederman, Jr.:- The official Census income "quintiles" do not contain equal shares of the population, and this fact skews the Census' measure of income distribution. . . The top quintile contains 24.6 percent of the population, but the bottom quintile contains only 14.3 percent. In raw numbers, there are 69.4 million persons in the top quintile compared to 40.3 million in the bottom. Thus, for every person in the lowest quintile there are 1.7 persons in the top quintile. This imbalance in population is a major factor contributing to the apparent levels of inequality in Census Bureau figures.
The Census Bureau quintiles are unequal in size because they are based on a count of households rather than persons. A household is defined as a person or group of persons living in a single housing unit. In the United States, high-income households tend to be married couples with many members and earners. Low-income households tend to be single persons with little or no earnings. Thus, it should be of no surprise that the average household in the Census' top quintile contains 3.2 persons, while the average household in the bottom quintile contains 1.8 persons.
The typical Census practice of measuring inequality by comparing aggregate incomes between "quintiles" that contain widely differing numbers of persons can be extremely misleading. To a considerable degree, the relative poverty of the Census' official bottom quintile. . . results from the simple lack of people within the quintile rather than from economic factors.
A far clearer picture of income inequality can be obtained by adjusting the quintiles so that each actually contains 20 percent of the population. [After adjusting for population], the income share of the bottom quintile rises to 9.4 percent of total income and the share of the top quintile falls to 39.6 percent. - The official definition excludes non-cash income and taxes. The first adjustment adds "nearly $700 billion to the total annual income and decrease income inequality;" the second "reduces annual total income by some $1.4 trillion and markedly decreases inequality."
Rector and Hederman estimate that making both adjustments would reduce the ratio of income disparity between the top and bottom quintiles from 14.3 to 4.21. This suggests the rich on average earn only a bit more than 4 times the poor--a number not obviously per se unjust to anyone other than doctrinaire Marxists. - The official Census income "quintiles" do not contain equal shares of the population, and this fact skews the Census' measure of income distribution. . . The top quintile contains 24.6 percent of the population, but the bottom quintile contains only 14.3 percent. In raw numbers, there are 69.4 million persons in the top quintile compared to 40.3 million in the bottom. Thus, for every person in the lowest quintile there are 1.7 persons in the top quintile. This imbalance in population is a major factor contributing to the apparent levels of inequality in Census Bureau figures.
- Income inequality is unrelated to poverty: Even if incomes were unequal, it's far from clear there's any relationship between poverty and income inequality, much less that inequality causes poverty. In The Skeptical Environmentalist, Lomborg flatly denies the link (see page 75, figure 35), with data showing that inequality in both the developed and developing world peaked in the 1950s and has sharply declined since.
Indeed, and despite widespread scorn for the "trickle down" economics associated with President Reagan, Reagan was right that a rising tide lifts all boats, says Seth Norton in the CATO Journal:The incomes of the poor are intimately linked to the incomes of the rich. While the relationship is not one-for-one, it is notable. The incomes of the poor rise more with increases in the incomes of the rich than vice versa. More importantly, the incomes of the rich have a discernable effect in reducing the UN’s conventional measure of poverty. Notably, growth in the incomes of the rich reduces the effects of poverty proportionally more than is the case for increases in the incomes of the poor. . . The results for sub-Saharan Africa are not appreciably different from the rest of the world. The term “trickle-down” is a misnomer: growth actually entails a cascade, not a trickle.
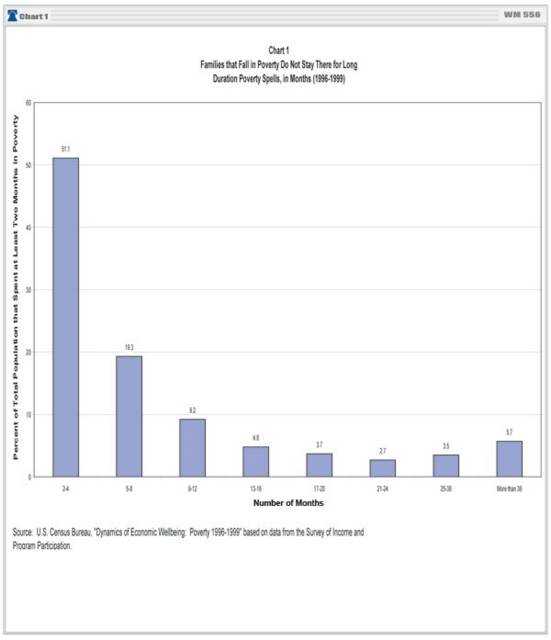
So inequality is not a good surrogate for poverty (nor, as I will explain in Part 2 of this series, will leveling incomes reduce the number of the poor). - Americans have substantial income mobility: Even if the poverty numbers are accurate, they're misleading. Annual measures of persons or households defined as poor are only a snapshot, valid for an instant. A person might be poor in December, but above the poverty line by February.
Poverty might be a more acute problem for society if the poor remain poor. Economists call the fluidity of earnings this "income mobility," and it's important to consider when addressing poverty, as the Heritage Foundation argues:The comparison of average incomes and taxes paid by groups would be meaningful only if America were a caste society in which the people comprising one group remained constant over time. Most Americans, however, understand that family incomes change frequently, and the research on income mobility reveals that most family incomes increase significantly over time.
After all, if the poor aren't poor for long, some government anti-poverty programs might not be necessary.
The numbers support the notion that poverty isn't caused by some systemic failure in the American economy. According to the Joseph Rowntree Foundation, "[i]n the 1990s, over a third of people on low incomes escaped from poverty between one year and the next." Similarly, the Census Bureau says only about 12 percent of the poor remain in poverty for three years. Here's the data on income mobility:
Transitory Poverty (click to enlarge)
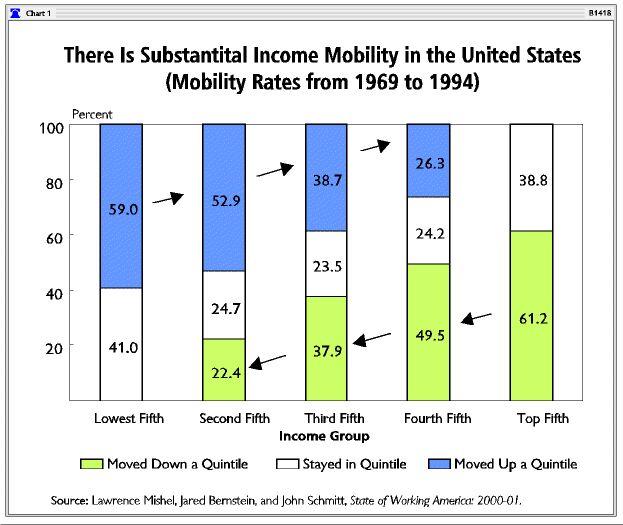
D. Mark Wilson of the Heritage Foundation agrees, citing -- among other sources -- a "1996 Urban Institute study concluding that large numbers of Americans move into a new income quintile, with estimates ranging from 25 percent to 40 percent in a single year. The same study found even higher mobility rates over longer periods: about 45 percent over five years and 60 percent over 9-year and 17-year periods." Wilson's data is even more dramatic:
Mobility 1969 to 1994 (click to enlarge)
Says Wilson, "The fact is that the U.S. economy, while not without its problems, remains dynamic, open, and productive enough to enable Americans to rise as far and as fast as their dreams, hard work, and perseverance will take them." But Census Bureau poverty figures are by definition static, and thus overstate the problem. - Health insurance coverage is similarly fluid: The left is convinced there's a crisis in health insurance. It's true that millions of Americans are uninsured. But not the same millions. Indeed, according to the Heritage Foundation, "[t]he typical family that loses health insurance is uninsured for only 5.6 months on average":

Ephemerally Uninsured (click to enlarge)
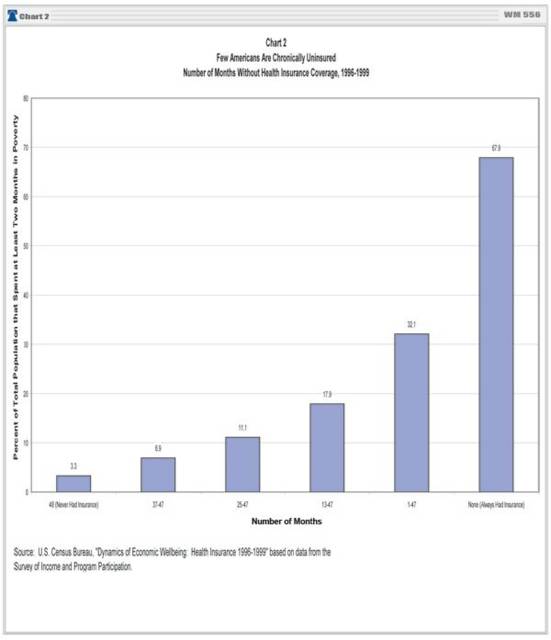
In other words, very few of the uninsured never had health insurance. The Census Bureau shows similar figures, measured by persons, as opposed to households: 85 percent of Americans without health insurance are covered within three years. And a Census Bureau study conducted in the late nineties confirmed Americans move in and out of insurance coverage:
Few are "Never Covered" (click to enlarge)
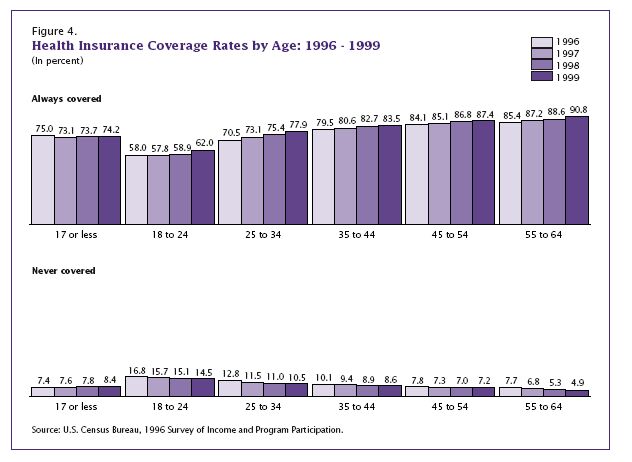
This explains why the age group least covered by health insurance is young adults: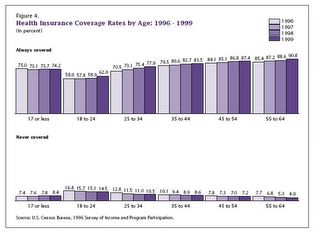
Coverage by Age (click to enlarge)
The figures unsurprisingly reflect the tax code's tie between health insurance and employment--young adults acquire insurance with entry-level jobs. But it also suggests deliberate choice. Young adults are statistically healthier than other age brackets, suggesting that some may deliberately choose not to be covered. This may not be a bad bet at that age, and there's no compelling reason for the government to override an individual's decision to "gamble." In any event, a static count of the uninsured doesn't prove poverty--because the same "mobility" exists in health coverage. - Conclusion: By any statistical measure, the poor are less so than their historical antecedents. Moreover, it's clear poverty isn't permanent. Those in poverty mostly -- via their own efforts, most often through employment -- typically lift themselves out of poverty within a short time.
That doesn't mean Americans should be unconcerned about poverty. Nor does it mean government anti-poverty programs are, per force, a mistake. But it does imply that panic is premature.


More:
A different Census Bureau report shows that only about 13 percent of those who become poor remain in poverty after 24 months:

Census Bureau P70-63 (1998)
Still More:
In the August 19th NRO, Jerry Bowyer provides further evidence of narrowing income inequality:
 (source: NRO)
 A few months later, David Henderson's Income Mobility: Alive and Well comprehensively examined income mobility validating the analysis above. And, as AEI's Nicholas Eberstat explained in September 2006:
[T]he official poverty rate is not reflecting shifting living conditions in the United States. A wealth of evidence shows that those who are counted as poor today have dramatically higher living standards than their counterparts in the 1960s, when the poverty rate was originally devised.Finally, here's Cafe Hayek's Don Boudreaux:
[W]ould you prefer to live in 1967 with today’s real median household income ($46,326) or live today with 1967’s real median household income ($35,379)? (These figures are expressed in 2005 dollars, by the way.)More & More:
Given these two options, I’d choose to live today with only 1967’s real median household income. The reason is that the economy today offers so very many more options than did the economy in 1967 – or even the economy of that halcyon year, 1973. Today I can buy cell-phone service; today I can buy cable television with hundreds of channels, including ones that specialize in sports, cooking, history, and science; today even the cheapest automobiles are safer and more reliable than were the finest cars for sale in 1967; today I can buy telephone answering machines (with caller-ID), microwave ovens, CDs, personal computers, Internet service, and MP3 players. Today I can watch movies in my own home – in color – whenever I want without having to wait for one of the three or four available television stations to telecast a movie for viewing on a black-and-white television.
Once a year, the World Bank takes the temperature of the global economy, especially for the Developing world. According to James Peron, writing in the December 13, 2006, TCS, those working in DC's 18-20th and Pennsylvania-E Street area -- and their client customers in the Third World -- should be in very good cheer:
The report, Global Economics Prospects 2007 says "developing economies are projected to grow by 7.0 percent in 2006, more than twice as fast as high-income countries (3.1 percent), with all developing regions growing by about 5 percent or more." While these nations have only 22 percent of global GDP they accounted for 38 percent of the increase in global output. And they are expected to increase their share of global output by about 50 percent by 2030.David Ricardo was right: free global trade, reduce global income inequalities.
The report expects the world economy to grow from last year's $35 trillion to $72 trillion by 2030. And this "is driven more than ever before by strong performance in the developing countries." Only two decades ago the poor nations provided only 14 percent of wealthy nations' manufactured imports. Today they provide 40 percent and by 2030 they are projected to provide over 65 percent.
As it was over the last 25 years it is the poor who will benefit the most. "The number of people living on less than $1 a day [in constant dollars] could be cut in half, from 1.1 billion now to 550 million in 2030." And the number living on less than $2 per day will decline by an estimated 800 million. . . .
For the next 25 years the report estimates that developing nations will increase their wealth by an average of 3.1 percent per year, above their average of 2.1 percent for the last 25 years. "That rate of increase will produce average per capita incomes [constant dollars adjusted for purchasing power parity] in the developing world of $11,000 by 2030, compared with $4,800 today, roughly the level of the Czech Republic and the Slovak Republic today."
The net result is that the income of developing countries "will continue to converge with those of wealthy countries. This would imply that countries as diverse as China, Mexico and Turkey would have average living standards roughly comparable to Spain today."
MORE4:
Follow on posts here and here.
MORE5:
Poor is a relative term, reminds Heritage's Robert Rector:
* Forty-three percent of all poor households actually own their own homes. The average home owned by persons classified as poor by the Census Bureau is a three-bedroom house with one-and-a-half baths, a garage, and a porch or patio.MORE6:
* Eighty percent of poor households have air conditioning. By contrast, in 1970, only 36 percent of the entire U.S. population enjoyed air conditioning.
* Only 6 percent of poor households are overcrowded; two-thirds have more than two rooms per person.
* The typical poor American has more living space than the average individual living in Paris, London, Vienna, Athens, and other cities throughout Europe. (These comparisons are to the average citizens in foreign countries, not to those classified as poor.)
* Nearly three-quarters of poor households own a car; 31 percent own two or more cars.
* Ninety-seven percent of poor households have a color television; over half own two or more color televisions.
* Seventy-eight percent have a VCR or DVD player; 62 percent have cable or satellite TV reception.
* Eighty-nine percent own microwave ovens, more than half have a stereo, and a more than a third have an automatic dishwasher.
According to the Census Bureau, the median duration for receiving food stamps is six months, with 40 percent of such spells four or fewer months and only 20 percent more than two years.
1 comment:
I also have a buddy, that will really enjoy this page, so ill send them, a link to your website, as well. I am sure they will really like it.
Post a Comment